The US and global economies are doing well. Here in the U.S., natural disasters such as hurricanes and fires seem to have had little or no effect on economic growth. The European Union is experiencing their best economic expansion in years and Japan is experiencing their best growth since the 1990’s. In fact, the majority of the world’s economies seem to be doing quite well. The markets are in a unique place where the confluence of improving global growth and the still very accommodative policies of Central Bankers is providing the backdrop for a continued bull market in stocks while allowing bond yields to rise gradually.
So, with all this good news what could go wrong?
Certainly, there are geopolitical risks on the Korean Peninsula and in the region around the Persian Gulf; also, there are political issues that could arise both in the US and in Europe. Given the global dependency on cheap money, the largest economic risk is a misstep by major central banks.
Around the globe, economies have improved to such a degree that Central Banks are gradually moving away from some of their post-financial crises policies. We are now entering the more difficult process of normalizing and removing some of the extraordinary measures put in place over the years.

Since 2008, Central Banks have grown their assets to more than $27 trillion through a process coined “Quantitative Easing.” Quantitative Easing entails printing money and buying stuff—primarily bonds but also stocks. Through these purchases, Central Banks have created an enormous amount of excess liquidity, which is sloshing around the globe. The four largest Central Banks by holdings are:
- The Peoples Bank of China (PBOC) at $5.3 trillion;
- European Central Bank (ECB) at $5.2 trillion;
- Bank of Japan (BOJ) at $4.5 trillion; and
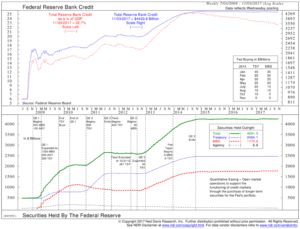
- The US Federal Reserve at $4.4 trillion.
Central Banks now own more than 1/3 of all the marketable bonds in the world.
The moves by the Central Banks to add liquidity to the global economy has driven bond yields to unusually low levels for a sustained period and has driven higher asset pricing from real estate to stocks. For example, European junk bond yields are lower than the yield of US 10-year Treasuries. In other words, a corporation in Europe with questionable ability to repay its debts is charged less to borrow money than the largest most diversified economy in the world. This is an example of both yield compression and overvalued asset pricing.
Central Banks are now in the very early stages of paring back some of this excess liquidity. The Federal Reserve began to shrink their balance sheet in October, for the first time since the financial crises. They are starting by selling $6 billion in Treasuries and $4 billion in Mortgage-Backed Bonds—the equivalent of $10 billion Bonds a month. Over time, our expectation is that the Federal Reserve will gradually increase their bond sales in an effort to normalize their balance sheet. The European Central Bank announced that they would further reduce their bond purchases starting in January, reducing their monthly purchase by half, from €60 billion down to €30 billion. Assuming the European Union maintains its growth rate, it is expected that they will stop bond purchases all together in the first part of 2019. The Bank of Japan also seems to be quietly slowing their asset purchases.
Central Banks added extraordinary amounts of money into the global economy to mitigate the effects of the financial crisis. They did this by buying up assets and driving short-term rates to historically low levels. However, as the economic backdrop improves the need for excess liquidity diminishes, which in turn drives Central Bankers to become less accommodative. For a global economy and investment markets that have been driven by essentially free money for nearly a decade, the transition back to some degree of normalcy will likely be bumpy.
For example, you could see economic growth accelerate causing higher inflation. The rising inflation could then drive central banks to raise short-term interest rates and/or sell their bonds more rapidly than expected. This would create a shock wave through the bond market; causing a rapid rise in interest rates and a sharp repricing of assets. In other words, the path to normalization of economic policy may not be a smooth one. As we are just beginning the process to normalization, we remain in a sweet spot where global growth is healthy and Central Banks still remain accommodative.
Bond Market
While we remain upbeat on global growth, we also remain cautious towards the bond market, with global Central Banks beginning to move away from their extreme accommodative stance. Our expectation is that interest rates will gradually move higher, putting downward pressure on bond prices. This movement towards higher rates should be a slow grind over several years with bouts of unpleasant volatility affecting the fixed income markets.
For Fixed-Income investors we believe the best approach in this market environment is to maintain a short-term ladder utilizing high quality Municipal and Corporate Bonds, Treasury Inflation Protected Securities, Variable Rate or Step Up Bonds, and, on a tactical basis, Convertible Securities and High Yield Bonds. We would avoid long-dated securities or funds with long durations.
Equity Market
As discussed above the US and global economies seem to be doing well. This in combination with still incredibly cheap money has allowed stock markets across the globe to continue to rally. As you can see from your portfolios, in the US our favorite sectors are Financials, Technology and Industrials. We also have been adding positions to reflation driven industries such as Energy. From an international perspective, we still like Europe and believe that Emerging Markets could be in the early stages of a multiyear upswing.

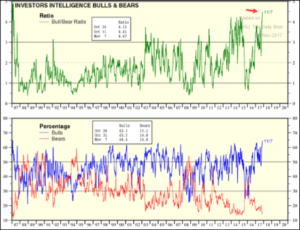
In the near term, the US market seems to have gotten a little ahead of itself and valuations remain stretched. More recently, some of our sentiment indicators have also gotten a little extreme and indicate we could be approaching a pause or pull back in the markets. For example, Investors Intelligence Bulls vs. Bears Indicators is at multi-decade highs. High bullish sentiment tends to correspond with tops or overheated markets while high bearish sentiment tends to correspond with market bottoms. Currently Bulls are at 64.4 while Bears are at 14.4, the spread between the two stands at 50, which is just below the 1987 peak of 50.5. Current readings are at least one sign of a stock market that is ahead of itself.

Typically, even in very good years, the market will have one or two mild corrections somewhere in the five to ten percent range. As of the writing of this piece, we have not seen so much as a 5% correction in the last 345 market days. This is highly unusual. A pause or pull back in the stock market would be healthy; setting up a better foundation for further advances through 2018. Much in the way a rain shower can clear the air, an occasional pull back or pause in the markets allows it to reset itself before moving forward. It is important to note, at this point, there are no indications that would suggest that the longer-term bull market in stocks is waning.
In Summary
The US and global economies are doing well. The markets are in a unique place where the confluence of improving global growth and the still very accommodative policies of Central Banks is providing the backdrop for a continued bull market in stocks while allowing bond yields to gradually rise. At this point any pullbacks in the stock market should be considered buying opportunities, while we remain cautious towards the bond markets. Down the road as the Federal Reserve moves more decisively into the Quantitative Tightening process, the risks to the markets may intensify.
We at Riggs have positioned your portfolios to take advantage of the current market conditions. We look to continue to make the best of the opportunities provided and to monitor and adjust our strategy should our indicators begin to rollover and risks increase.
IMPORTANT DISCLOSURES
Please remember that past performance may not be indicative of future results. Different types of investments involve varying degrees of risk, and there can be no assurance that the future performance of any specific investment, investment strategy, or product (including the investments and/or investment strategies recommended or undertaken by Riggs), or any non-investment related content, made reference to directly or indirectly in this newsletter will be profitable, equal any corresponding indicated historical performance level(s), be suitable for your portfolio or individual situation, or prove successful. Due to various factors, including changing market conditions and/or applicable laws, the content may no longer be reflective of current opinions or positions. Moreover, you should not assume that any discussion or information contained in this newsletter serves as the receipt of, or as a substitute for, personalized investment advice from Riggs. To the extent that a reader has any questions regarding the applicability of any specific issue discussed above to his/her individual situation, he/she is encouraged to consult with the professional advisor of his/her choosing. Riggs is neither a law firm nor a certified public accounting firm and no portion of the newsletter content should be construed as legal or accounting advice. A copy of the Riggs’s current written disclosure statement discussing our advisory services and fees is available upon request. If you are a Riggs client, please remember to contact Riggs, in writing, if there are any changes in your personal/financial situation or investment objectives for the purpose of reviewing/evaluating/revising our previous recommendations and/or services.
