In our July, 2018 Riggs’ Report “Removing the Punch Bowl—A Sign of Good Growth but a Tricky Business,” we stated:
…perhaps more important to the investment markets is how skillfully the Federal Reserve manages their quantitative tightening program. The actions of the Federal Reserve and the uncertainty around the trade negotiations could spook the investment markets and so we want to tread carefully right now. With that as the backdrop, we are also heading into a seasonally weak period in the market with mid-term elections looming. Our philosophy is that wealth is built by not only making money but also managing risk. As we see some elevated risk in the markets, we have built up some cash in your portfolios to first protect the portfolios and to take advantage of investment opportunities should the markets pullback.
Since July, our indicators have continued to deteriorate. This deterioration is now being reflected in the markets. For the month of October, the Dow Jones Industrial Average and S&P 500 are down -3.3% and -4.4%, respectively, NASDAQ is down -7.5% and market volatility has increased. As you know, we began raising cash in your accounts this summer as the risks in the investment markets began to outweigh the potential rewards. As it appears the correction is here, we are now evaluating our indicators to determine if this is a normal correction during a seasonally weak period or the setup for a new global bear market. In either case, our strategy is to use the cash to protect your portfolios and take advantage of any opportunities this market may provide. So let’s delve a little further into what we are seeing in the U.S. and Global economies.
While the U.S. economy remains robust with the strongest economic growth in more than a decade, it is that strong growth that provides the opportunity for the Federal Reserve to continue its path toward normalization of monetary policy. The strong jobs and wage growth accentuates this positive economic backdrop. For example, the unemployment level for people with less than a college degree is at the lowest level in more than two decades. Anecdotally, the recent announcement by Amazon raising their minimum hourly rate to $15 an hour for warehouse workers shows that unskilled labor is in short supply. Further, our research indicates that the chances of a recession here in the United States remain remote as tax cuts will likely continue to provide a tailwind for U.S. economic growth well into 2019 if not further.
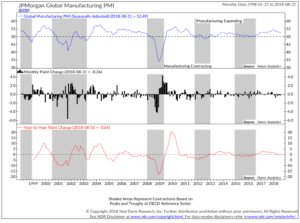
 However, on an international basis we have seen the rate of growth begin to slip, as indicated by the slowdown in the Global Manufacturing Purchasing Managers Index. While growth remains positive, it is decelerating. As the bottom clip of the chart shows, the rate of change for the Global Manufacturing Purchasing Managers Index has gone negative; this has often preceded down turns in the global economy.
One example of this slowdown is China. China’s Manufacturing Purchasing Managers Index has declined to 50. Any number higher than 50 indicates growth in manufacturing, while any number below 50 represents a decline –China is on the cusp of entering a manufacturing decline or worse. According to Danielle DiMartino Booth’s The Daily Feather “Guangdong is China’s most important manufacturing hub; its PMI (Purchasing Managers Index) fell to 49.3 in August, contracting for the first time in two years … its output is also dominated by export-oriented industries. Five months ago, Guangdong’s Manufacturing New Orders were at a seven-year high; they’ve since fallen a near-record 8.4 points to 48.7” – this is a dramatic decline to say the least.
China is the second largest economy in the World behind the United States. It used to be said that when the United States sneezed the rest of the world caught a cold. So, what happens if China sneezes? We may soon find out. It is worth noting the last two corrections in equity markets in 2011 and in 2015-16 were associated with economic slowdowns in China.
China is not the only country to experience a deceleration in economic growth. We are also seeing slowing economic growth in other regions across the globe. Of the 38 largest economies in the world, only 9 (including the United States) are showing continued expansions in their manufacturing industries, 1 is neutral, and the remaining 28 economies (including all of Europe’s largest economies) are seeing declines in their manufacturing growth. It looks like the global economy may be stalling.
“Trade wars and tariffs” are getting all the headlines and blame for this slowdown—to some extent they should. In our view, a more important factor is the steady removal of liquidity by the Central Banks or “Quantitative Tightening.”
 Over the past ten years, Central Banks around the world have pumped Trillions of Dollars, Euros, Yen, Francs and Yuan into the global economy. They did this by printing money, using that money to purchase bonds (and in some cases, stocks) and infusing liquidity (cash) into the markets. This process was referred to as “Quantitative Easing.” With the most recent actions of the Federal Reserve, that process is now being reversed and we have entered a period of Quantitative Tightening.
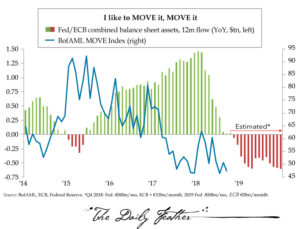
Starting October 1, 2018 the Federal Reserve will accelerate its balance sheet reduction (selling Treasury bonds and Mortgage-Backed securities) to $50B a month or $600B a year. The Federal Reserve plans to maintain this level of balance sheet reduction for the next few years. At the same time, the European Central Bank is reducing its purchases from €30B to €15B a month with an expectation that they will end all purchases at year-end.
For the first time since 2008, on a net basis liquidity is being removed from the system. Just as adding liquidity supported weaker economies and asset prices – removing liquidity may deflate weaker economies and asset prices.
The U.S. Dollar remains the World’s reserve currency thus removing U.S. Dollar liquidity from the system has a more pronounced effect than other currencies. Changes in liquidity tend to manifest themselves first in the debt markets. We have seen this play out in economically weaker economies such as Turkey and Argentina as they have had trouble funding their Dollar denominated debt. We will likely see similar and related scenarios play out in other areas as the Quantitative Tightening process continues.
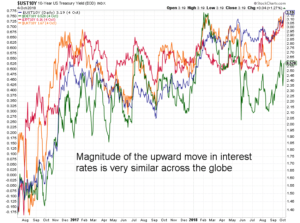
 One of the side effects of the Quantitative Tightening process will be a rise in interest rates. As the chart to the right illustrates we are seeing interest rates rise across the globe.
While parts of the global economy are under pressure, the United States has remained resilient. The strength in our economy is reflected in jobs growth and wage inflation. Historically, the Federal Reserve is very sensitive to wage inflation and are likely to remain on a steady path of short-term interest rate increases. This approach in combination with the systematic removal of liquidity will continue to push interest rates higher and bond prices lower.
We believe the best approach for fixed-income investors in this market environment is to be conservative. We would avoid lower quality fixed-income investments at this stage of the cycle. We would utilize high quality municipal and corporate bonds, Treasury bonds and Treasury Inflation Protected Securities in a short-term ladder. This approach should provide fixed income investors with decent current returns and flexibility to take advantage of higher interest rates in the future.
In the equity markets, we discussed last quarter that several of our equity market indicators were showing early signs of deterioration. Since that time, we have seen the equity markets begin to rollover and our indicators continued to weaken. While our expectation is that this should be a normal market correction prior to mid-term elections, there is also a possibility that the global slowdown we are seeing could migrate to the U.S.
Last quarter, we discussed three areas of concern in the equity markets—the breadth of the market, the performance of international markets and the reduction of liquidity in the markets. Let us see where each of these stand today.
- Market Breadth. Breadth is a measure of market strength. For example, a market where the majority of stocks are moving higher has strong breadth. Conversely, when the majority of stocks are moving lower it has weak breadth. Currently of all the companies listed on the New York Stock Exchange and the NASDAQ Composite only 31% are in up-trends. Typically, strong markets have 60% or better of companies in up-trends. In addition, we have seen the number of stocks making new highs shrink while the number of companies making new lows expand. Last quarter we characterized breadth as neutral but waning. Today, we would say breadth in U.S. equity markets has moved from neutral to just negative as it continues to wane.
- International Markets. The international markets have continued to under-perform the U.S. equity markets. Healthy market advances tend to be global in nature; with all regions of the world participating. Last quarter we noted “The fact that non-US markets are under-performing could be a sign that global growth is slowing.” Today, global growth is slowing as we discussed above.
- Liquidity. The rise of bond yields and the reduction of liquidity is affecting … economies across the globe. As we have stated, we are now in the early stages of a real Quantitative Tightening. For the last ten years, the combination of zero or negative interest rates plus the efforts of Central Banks around the globe to infuse trillions of dollars into the economy propping up both strong and weak organizations. Going forward we will be returning to an environment where the cost and availability of capital will place some organizations under stress. All other things remaining equal, Quantitative Tightening will place downward pressure on asset pricing.
With this as a backdrop, we are maintaining a strong cash position in your portfolios to provide protection to your capital and, once market risks subside, redeploy that cash to purchase good companies with strong fundamentals at discounted pricing. If you have any questions with regard to our investment strategy, please do not hesitate to contact us.
IMPORTANT DISCLOSURES
Please remember that past performance may not be indicative of future results. Different types of investments involve varying degrees of risk, and there can be no assurance that the future performance of any specific investment, investment strategy, or product (including the investments and/or investment strategies recommended or undertaken by Riggs), or any non-investment related content, made reference to directly or indirectly in this newsletter will be profitable, equal any corresponding indicated historical performance level(s), be suitable for your portfolio or individual situation, or prove successful. Due to various factors, including changing market conditions and/or applicable laws, the content may no longer be reflective of current opinions or positions. Moreover, you should not assume that any discussion or information contained in this newsletter serves as the receipt of, or as a substitute for, personalized investment advice from Riggs. To the extent that a reader has any questions regarding the applicability of any specific issue discussed above to his/her individual situation, he/she is encouraged to consult with the professional advisor of his/her choosing. Riggs is neither a law firm nor a certified public accounting firm and no portion of the newsletter content should be construed as legal or accounting advice. A copy of the Riggs’s current written disclosure statement discussing our advisory services and fees is available upon request. If you are a Riggs client, please remember to contact Riggs, in writing, if there are any changes in your personal/financial situation or investment objectives for the purpose of reviewing/evaluating/revising our previous recommendations and/or services
