
The first quarter was one marked by rising volatility in the stock market with a correction in January where the S&P 500 pulled back -5.8% and the DJIA pulled back by -7.3%. By the end of March the S&P 500 was up slightly for the year while the DJIA was down slightly for the year. Through this we took the opportunity to capture some of the large profits earned in our equity portfolios over the past two years. With those proceeds, we have made investments in sectors and companies with better near term valuations and upside opportunities. We have also increased our cash position. The fixed income markets have been quiet this past quarter as bond prices drifted slightly higher. All in all, as your statements reflect, your portfolios are doing well.
An Arctic Vortex and a Spring Thaw
 With the beginning of baseball season and hopefully the last snow storm behind us in the northeast, we should begin to see a pickup in economic activity. As the Population Density map illustrates, the areas of highest population density are from the Midwest eastward, and these areas were severely affected by the “polar vortex.”
Not only were Northern States affected by this unusually cold weather, but states in the southeast and south-central were also negatively affected by the Vortex. Anecdotally, a friend of ours who builds homes in North Carolina told us that he can usually muddle through and build through the winter. This year his building season was pushed back until the end of March. His experience is borne out in the national data. Now that spring is here, we would expect to see a pickup in activity in industries that are more weather dependent such as home building, construction and auto sales. Therefore our expectations are for a generally improving economic back drop as the year progresses. We would not be surprised to see an increase in economic activity through the spring and into early summer as the weather improves. With this pickup in economic activity, we may see some upward pressure on interest rates.
Fixed-Income
For fixed income investors we believe the two major factors that will drive the bond markets for the remainder of this year are: 1) a generally improving economy; and 2) the Federal Reserve scaling back its Large Scale Asset Purchase Program (LSAPP). As we discussed above, we see a generally improving economy as the year progresses. While this past winter did slow demand somewhat due to the unusually cold weather much of that demand was merely delayed rather than destroyed. For example, if you stayed home for dinner rather than go out to a restaurant because it was too cold that demand is gone. However, if you wanted to build a home or buy a car that demand was most likely only delayed.
In the southeastern United States the home building industry was significantly affected by the weather this winter. If one was interested in building a home in the Carolinas with a January start date, nothing could be done due to the cold and wet conditions. That project probably would not have started until late March or early April. The builder will now need to balance the delayed project with the ones on their spring schedule thus increasing the demand for resources such as manpower, heavy equipment, and building materials. This scenario is repeating itself, many times over from Texas to Georgia and throughout the south-central and southeastern United States. This increase in demand could cause an rise in economic activity this spring and into early summer, as three months of pent up demand is released. If so, we are likely to see this not only in economic activity but also in the behavior of the bond market.
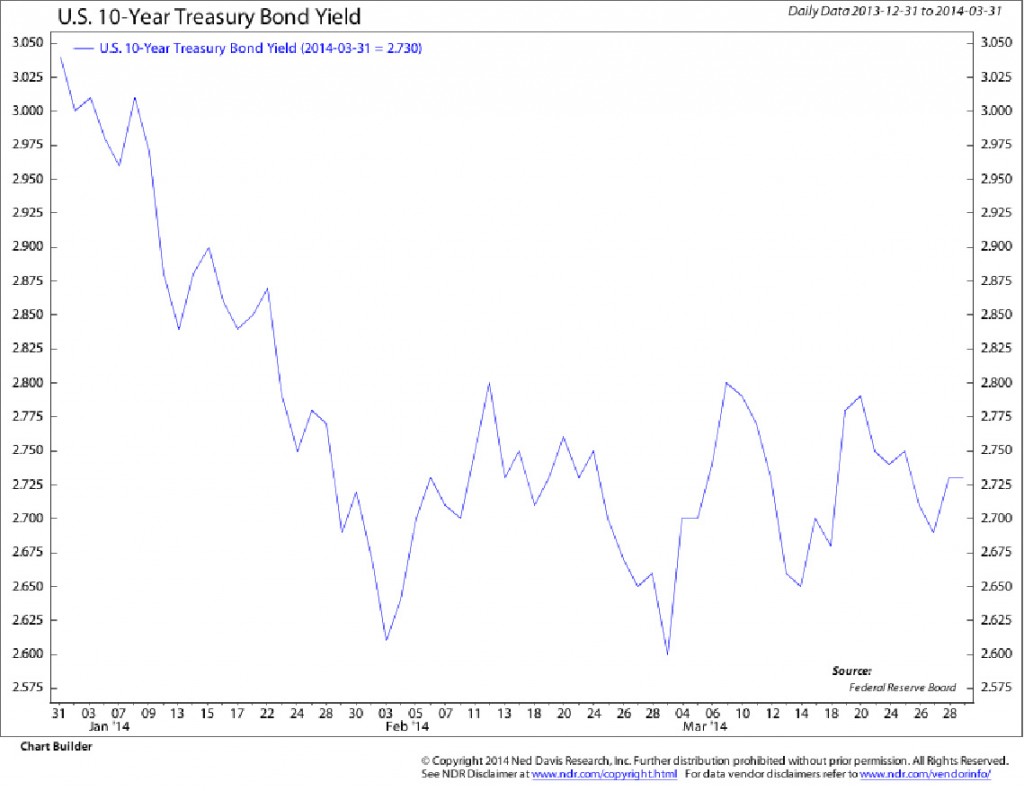
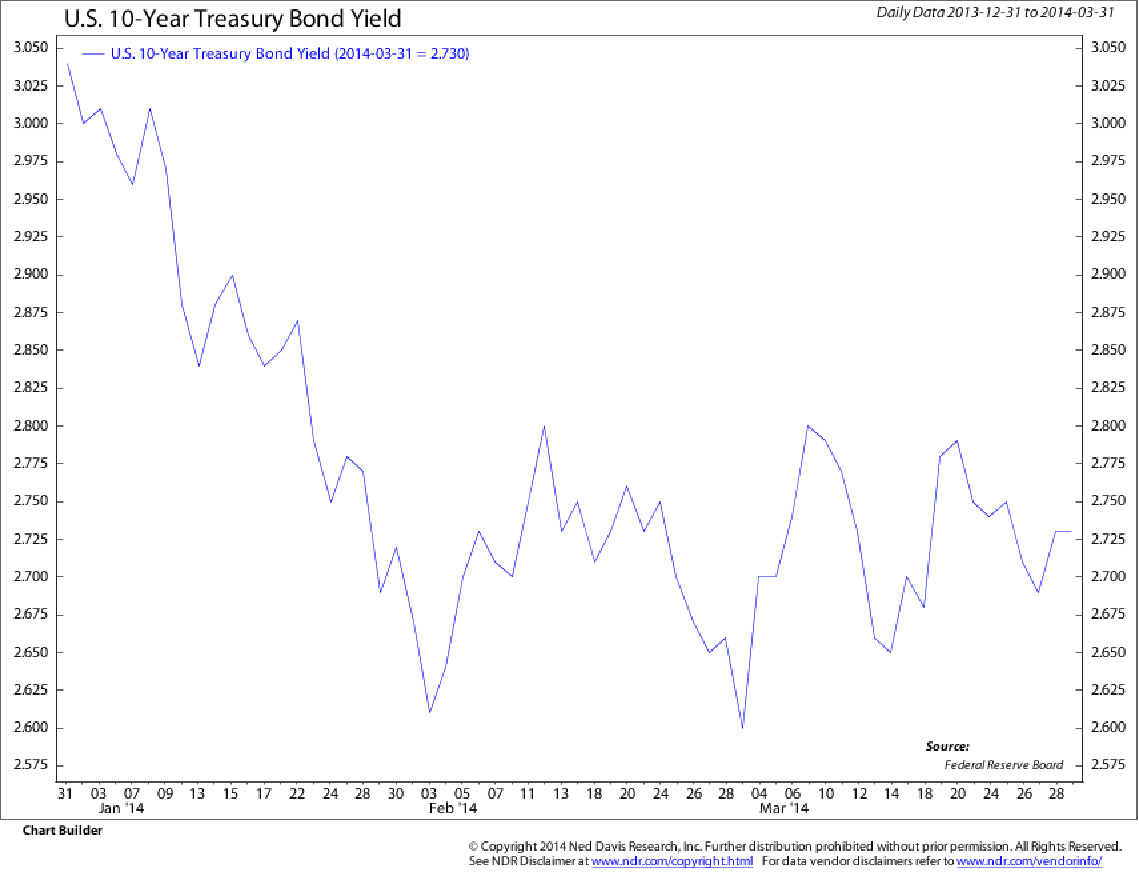
This chart of 10-Year Treasury yields shows that interest rates have generally trended lower since the beginning of the year. Much of this move was weather related and driven by concern of slower economic growth. As the country thaws out and activity picks up, we believe we will see interest rates begin to once again drift higher. A move above 2.8% on 10-Year Treasuries would be a sign that the bond market is seeing some positives in the economy and could mark the beginning of the next leg of higher interest rates and lower bond prices.
 Equity Markets
As we discussed, we have seen volatility increase in the stock market in the 1st Quarter of 2014. With the increase in volatility, there has also been a lack of any real sustained leadership in the markets. Typically in a healthy market, there is clearly identifiable leadership. Strong leadership for the markets comes from companies who are innovating—whether they are introducing new technology or adding technology to enhance production of old line industry. We clearly saw this in 2013 as biotechnology led the way. However, since January the major averages have been flat with NO sustainable leadership. Instead, we have seen markets churn. Sectors move forward, then pull back and indices remain flat. This type of market action is more indicative of a tired or toppy market than a healthy one. Much like a runner on a treadmill – while he may be running faster and faster there is no forward progress.
In our 2014 outlook stated “we enter 2014 with some concerns for the equity markets. These concerns broadly fall into three major areas: 1) equity valuations, 2) investor and market sentiment, and 3) the historical market tendencies during election years.” Let us revisit these and see where we stand today.
Valuation
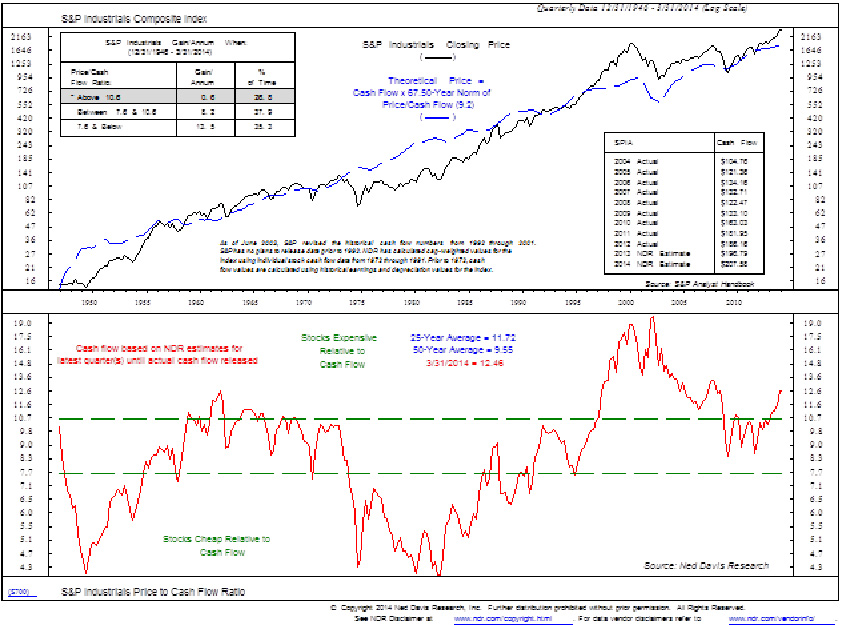 When we look at long-standing market valuation matrices such as Price to Cash Flow (right), Price to Dividend Yield, or Median Price to Earnings Ratio, valuations remain elevated. For example, the 40+ year average for Median Price to Earnings Ratio for the S&P 500 is 15.9%. Our latest data has the S&P 500 selling at 20.9%. While markets can stay overvalued for extended periods of times like they did in the late 1990’s, valuation remains a cautionary sign for the markets.
Sentiment
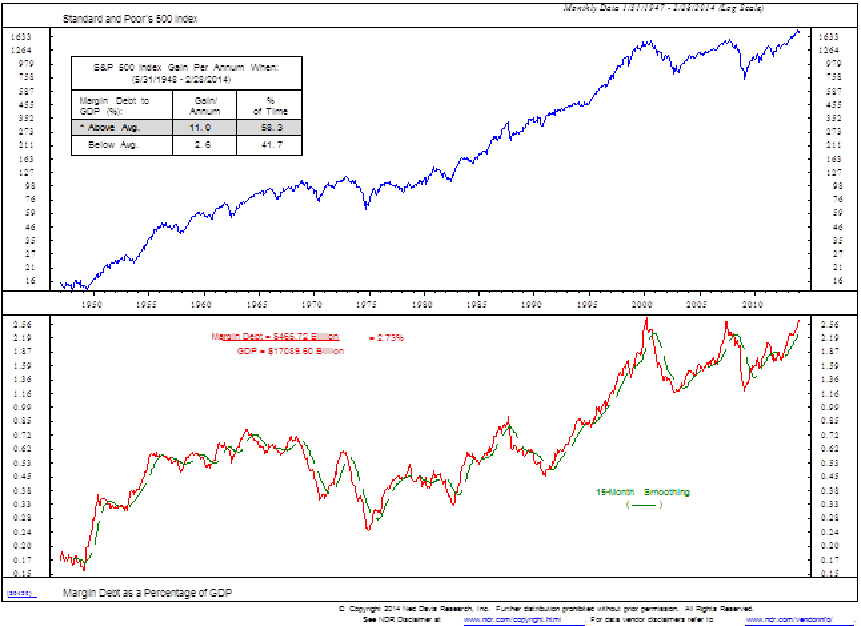
As we discussed in our 2014 Investment Outlook, “Valuation can also be considered a form of sentiment indicator: as investors become more confident with a market they put more and more money into it until most investors are fully invested and there is no one left to buy.” One sentiment indicator that illustrates valuation extremes can be the level of Margin Debt. As the chart on the right shows, Margin Debt as a percentage of GDP has now surpassed 2007 levels and is approaching levels last seen in 2000.
Finally, the mid-term elections are quickly approaching. Historically, during mid-term election years the market tends to do well during the first phase of the year, pullback as rhetoric escalates in the spring/summer and rally as the selection of candidates is clear. The median gain of the S&P 500 has been 6.9% in all mid-term election years since 1948….Given the extended valuations of the stock market, high sentiment of investors, and the normal historic tendencies during an election year, we believe that a correction in the stock market this year is probable. Our best guess is that we could see the markets pull back this year in the range of 20% give or take.
As you can see from your portfolios we have been proactive in moving towards a more cautious posture. As our technical and fundamental signals have begun to turn, we have moved to a higher weighting of cash and defensive holdings. We will use this strategy to preserve principal during any correction. We will use a correction in the equity markets as an opportunity to invest at discounted prices and allow holdings to appreciate going into a year-end rally.
![]()
In summary, we see a generally improving economy and although it is nothing like what we saw in the 1980’s and 1990’s, it is perhaps the best economy we have seen in seven years. We believe there is pent up demand as a result of a particularly harsh winter and we are likely to see a mini-surge of economic activity starting this spring. With the improvement in the economic back drop and the Federal Reserve reducing its bond purchases, we think interest rates will most likely drift higher while bond prices drift lower.
For equity investments, the markets are looking tired. We have some concerns when we look at market valuation, sentiment and historical trends. As a result, we have moved to a more defensive posture in your portfolios. We believe that the markets are in transition, with U.S. equity markets moving into a long-term (a decade or more) bull market and with U.S. fixed income markets moving into a long term bear market. As a result, our orientation has transitioned from a balance of equities and fixed income to a higher orientation to equities and a lower orientation to fixed income. We believe that the equity markets will continue to benefit from economic tailwinds but the fixed income markets will continue to face headwinds.