Seeing Opportunities
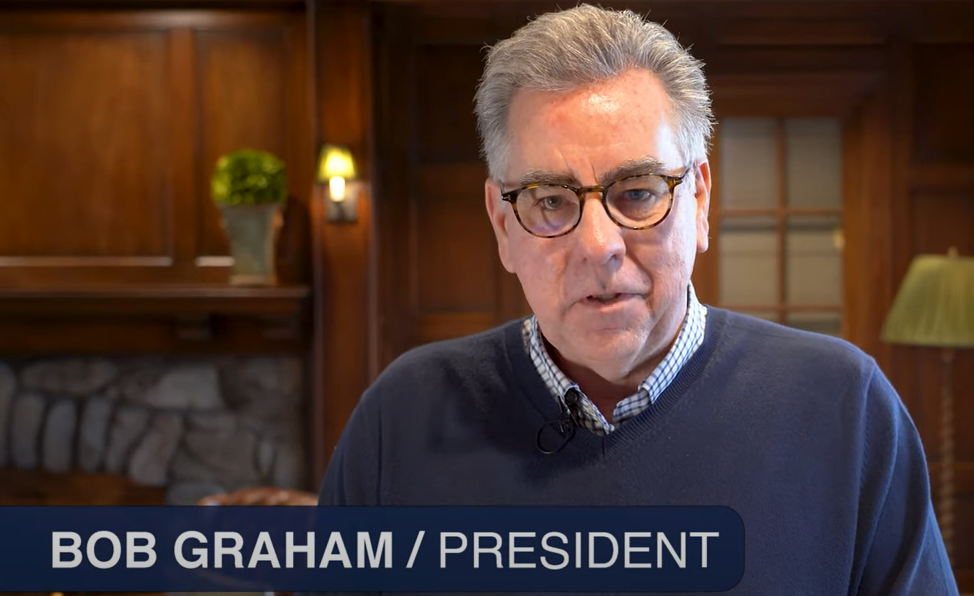
It was another down day in the markets. Every year for the past 40+ years, the market has experienced an intra-year drawdown with an average drawdown of -13%. Since 1974, the S&P500 has risen an average of 8% one month after the bottom and an average of 24% one year later. Looking at the Fear vs. Greed Index, we are starting to see sentiment in the “Extreme Fear” range. So it is likely that most investors who have wanted to sell have likely sold. Further, negative returns in August, September and October have only happened once in 30+ years. When there are no more sellers, what is left is buyers. We think we may see the end of this correction as early as next week. And while this annual drawdown is unpleasant, it does create buying opportunities for the next leg up in the markets. The old Wall Street adage “When it is time to buy, you won’t want to” still holds true. This short video discusses where we are seeing opportunities as a result of the recent volatility.


