
The U.S. economy continues to hum along and we are now seeing signs of economic expansion in China and Europe as well. The equity markets have rallied higher the first half of 2017 and, historically, a good first half of the year bodes well for continued stock market growth in the second half. As global economies gain momentum, we are seeing Central Banks move forward with unwinding their accommodation policies. As you know, the actions to promote economic growth by Central Banks over the last nine years is unprecedented so the process to normalize and unwind the easy money policies puts us in unchartered waters. The risk to the fixed income and equity markets is that the Central Banks will overshoot and tighten too quickly stunting economic growth. While that has not happened, it is a risk to the financial markets. In the meantime, the investment markets continue to move higher spurred on by not only strong quarterly earnings results but also guidance from CEOs that they are focused on expansion and reinvestment.
Economy
Our economic indicators are signaling a second half pickup in economic growth led by improved capital expenditures.
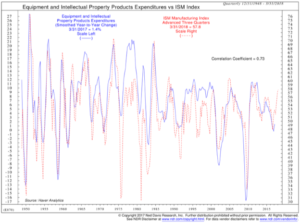
The ISM Manufacturing Index is a good leading indicator of future plant and equipment expenditures by corporations. As can be seen by the chart, the ISM Manufacturing Index is predicting a significant pick up in spending by corporations on plant and equipment over the next several months.
As we discussed in our April, 2017 Riggs’ Report “Seeing Opportunities in the U.S. and Abroad,” this is not just a U.S. phenomenon—we continue to see improvements in Europe and more recently improvement in China.
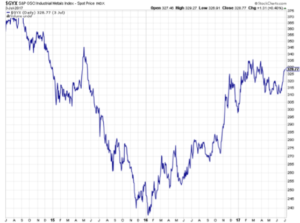
Another positive sign of economic expansion can be seen in the pricing of industrial metals—Aluminum, Copper, Zinc, Nickel and Lead—widely used for industrial purposes. The S&P GSCI Industrial Metals Index reflects the pricing of five different widely used Industrial Metals—Aluminum, Copper, Zinc, Nickel and Lead. The pricing of industrial metals can act a bit like “a canary in a coal mine” in that as long as the air is clean the canary continues to chirp or in this case, as long as the global economy remains healthy the demand and price for industrial metals remains strong.
From mid-2014 into 2016, these metals sold off sharply as risk of a global slow down became more acute reaching their lowest levels since 2009. However, since then we have seen a steady improvement indicating a better economic backdrop and an increase in industrial activity.
On an anecdotal basis, we have spoken with several small and mid-size business owners from construction firms to contract manufacturing firms and the message is consistently similar, they have seen a significant pick up in both the quality and quantity of business. Long time readers of the Riggs’ Report know that the lifeblood of any economy is small and mid-size business. Smaller businesses are the primary driver of employment and entrepreneurial creativity. When small and mid-size businesses thrive, the economy thrives.
However, all of this good economic news encourages Central Banks to remove their post-crisis accommodation and in doing so could affect asset prices. Since the 2008 Financial Crisis, Central Banks across the globe have kept short-term interest rates at or below zero while buying up bonds in an effort to provide stability and liquidity to the global economy and spur economic growth. One of the aftereffects of these measures has been a significant rise in asset prices—from stocks to bonds to commercial real estate. Over the past few months, each of the world’s major Central Banks either began to take steps toward removing these accommodative policies or have made statements indicating that policies would be shifting from easing mode to tightening mode. For example:
- The U.S. Federal Reserve increased short-term interest rates for the fourth time in June and, importantly, laid out a plan to reduce its purchase of Treasuries and Mortgage-Backed Securities. That plan could begin as early as October.
- The European Central Bank removed the rate bias of even lower rates in the near-term.
- Two additional members of the Bank of England’s Monetary Policy Committee wanted to hike rates indicating the post-Brexit accommodation by the Bank of England will likely soon be removed.
- The Bank of Canada initiated an interest rate hike.
- The Bank of Japan has been buying fewer bonds, about ¥60 trillion a year instead of ¥80 trillion.
While this is not a coordinated move by Central Banks, per se, they are all beginning to move in the same direction, at the same time. That direction is to move away from crisis-level accommodation and remove excess liquidity from the global economy. These accommodative policies have been in place since the 2008 Financial Crisis and have been a principal driver in increasing asset prices.
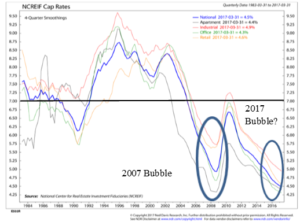 One example of this increase in asset prices can be seen in the commercial real estate market. The chart to the right is a broad based index of the capitalization rates (cap rates) for the major segments of the commercial real estate market across the U.S
The cap rate is a valuation measure for commercial real estate used to compare different real estate investments.
In its simplest form, the cap rate is calculated by dividing the net operating income by the price paid or current value of the property. For example, if a building is purchased for $1,000,000 and it produces $100,000 in net operating income then the cap rate is 10%: $100,000 / $1,000,000 = 10%. Historically, cap rates much below 7% have been considered “frothy.”
While real estate is all about “location, location, location” and pricing around the country can vary significantly, cap rates are generally consistent. We are now seeing valuations in commercial real estate above the bubble pricing we saw in 2007.
Obviously, we have been discussing the valuation of the U.S. stock market with our clients for a few years now so commercial real estate is not the only asset class hitting record valuations. With high levels of valuation, we are now entering the tricky part of unwinding quantitative easing—how do Central Bankers remove this accommodation without deflating inflated asset prices? The answer is, very carefully. Any overshoot in this process could have significant impact on stocks, bonds, and commercial real estate values.
The Bond Market
For fixed income investors, global yields are on the rise and bond prices will likely remain under pressure for some time.
The chart on the next page illustrates the movement in Japanese, German and U.S. 10-Year government bond yields since July of 2016. As you can see they are all moving higher, and that the movement seems highly correlated.
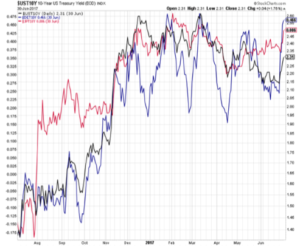
While we remain upbeat on global growth, we also remain cautious towards the bond market, with all of the major central banks moving towards a less accommodative stance. Our expectation is that interest rates will gradually move higher, putting downward pressure on bond prices. This movement towards higher rates will be a slow grind over several years with bouts of unpleasant volatility for fixed income investors.
For fixed income investors we believe the best approach in this market environment is to maintain a short-term ladder utilizing high quality municipal and corporate bonds, Treasury Inflation Protected securities, variable rate or step up bonds, and, on a tactical basis, convertible securities and high yield bonds. We would avoid long-dated securities or funds with long durations.
The Equity Markets
The first half of 2017 has been good for equity investors both in the U.S. and internationally, as equity markets have steadily moved higher. A good first half of the year bodes well for the second half. Since 1950 when the first half of the year has been positive, the second half is also positive 78% of the time, so statistically, those are good odds. Our expectations are for the equity markets to generally trend higher throughout the rest of the year—but, perhaps, with the typical “summer swoon.”
Currently, the U.S. equity markets are experiencing some sector rotation as money is rotating out of Technology into Financials and Healthcare. As you know from your portfolios, over the past month or so we have been taking profits in our Technology holdings and have been reallocating those funds toward sectors with much better values such as Financials and Healthcare. For the second half of the year our expectations are that Financials, Healthcare and Industrials will lead the U.S. markets.
Internationally we still like Europe and the emerging markets. In Europe, settling the banking crisis in Italy is a big deal. Italy had become a cash economy where people did not put money into banks for fear of having it confiscated in order to recapitalize the banks, thus, the banks could not lend money to business or people wishing to purchase a home. The banking issue led to a downward spiral of the Italian economy. In Europe, there is no FDIC insurance to protect depositors, under European Union law, deposits are supposed to be used to recapitalize failing banks, as they did in Cyprus.
The Italian government essentially ignored the European Union law and borrowed money to bail out its banks. The loans were facilitated through the European Central Bank’s bond buying program, while the bureaucrat in Brussels pretended not to notice.
Regardless, beginning to resolve the banking crises in southern Europe is huge. This action should help spur economic growth and improve employment. All in all this is good for Italy, Southern Europe and good for the European stock markets.
With valuations low both on an absolute and relative basis compared to the U.S. markets, international markets could well outperform the U.S. over the coming months and years.
As you know we have been concerned about the valuation of the U.S. stock market for some time. Similar to the inflated asset pricing we are seeing in commercial real estate, we are seeing similar pricing inflation in the U.S. stock market. There are only two periods in U.S. history where valuations where higher—the first was the late 1920’s (not shown) and the second was the post Y2K bubble in technology in the early 2000’s.
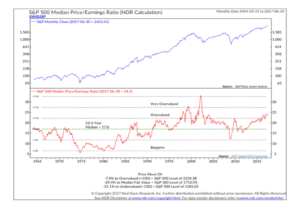
In both cases, the market eventually corrected to the down side. With Central Banks becoming more aggressive in their removal of their crises level accommodations, we could eventually see the prices of inflated assets normalize. However, we do not see any indication of that in the near term. The policies of the Federal Reserve have stabilized the system and we are seeing economic growth momentum. The Federal Reserve has laid out a plan for slowly removing liquidity from the system and if they execute well on that plan, we just may get the soft landing we are all hoping for. In the meantime, we are taking advantage of a market moving higher and trying to find pockets of opportunities in undervalued sectors and/or companies.
Summary
Currently, we remain positive on our outlook for U.S. and Global growth as our economic indicators point to further economic improvement and expansion. As the Global economy expands, the need for Central Banks to provide unprecedented liquidity evaporates. Assets from stocks to bonds to commercial real estate have benefitted from these policies and could come under pressure as Central Bank policies normalize. This will be the tight rope that Central Bankers must walk.
The general trend for equities is for a continued move higher (though it would not surprise us to see a typical summer pullback). Our current favorite U.S. sectors are Financials, Healthcare and Industrials. We also like some specific international areas as they have attractive valuations. With interest rates on the rise, we will continue to see downward pressure on bond prices. While U.S. stock market valuations are high, they should continue to move higher with economic expansion. However, we are entering a period where there is greater potential for policy mistakes from Central Bankers across the Globe so a focus on policy impacts to the markets is needed. We will continue to keep a vigilant eye on the implementation of these policies and take action to protect your portfolios should we see any indication of a misstep.
IMPORTANT DISCLOSURES
Please remember that past performance may not be indicative of future results. Different types of investments involve varying degrees of risk, and there can be no assurance that the future performance of any specific investment, investment strategy, or product (including the investments and/or investment strategies recommended or undertaken by Riggs), or any non-investment related content, made reference to directly or indirectly in this newsletter will be profitable, equal any corresponding indicated historical performance level(s), be suitable for your portfolio or individual situation, or prove successful. Due to various factors, including changing market conditions and/or applicable laws, the content may no longer be reflective of current opinions or positions. Moreover, you should not assume that any discussion or information contained in this newsletter serves as the receipt of, or as a substitute for, personalized investment advice from Riggs. To the extent that a reader has any questions regarding the applicability of any specific issue discussed above to his/her individual situation, he/she is encouraged to consult with the professional advisor of his/her choosing. Riggs is neither a law firm nor a certified public accounting firm and no portion of the newsletter content should be construed as legal or accounting advice. A copy of the Riggs’s current written disclosure statement discussing our advisory services and fees is available upon request. If you are a Riggs client, please remember to contact Riggs, in writing, if there are any changes in your personal/financial situation or investment objectives for the purpose of reviewing/evaluating/revising our previous recommendations and/or services.